Congressional stock returns: try the mean.
This study reached Hacker News claiming that copying House members’ stock trades wouldn’t beat the market. My objection in the thread, as seizethecheese: corrupt trades could be among the extreme results. Showing that lots of trades look normal doesn’t rule that out.
The study focused on the median—the middle trade. But a few big winners can account for most of your profits. So I redid the calculations using the mean: add up every return, then divide by the number of trades. This includes the big winners. It doesn’t tell us whether any trade was corrupt.
Two comparisons: the usual S&P 500, where bigger companies count more (the SPY fund), and the S&P 500 with roughly equal money in each company (the RSP fund). Below, “points” means percentage points: a 12% return beats a 10% return by 2 points.
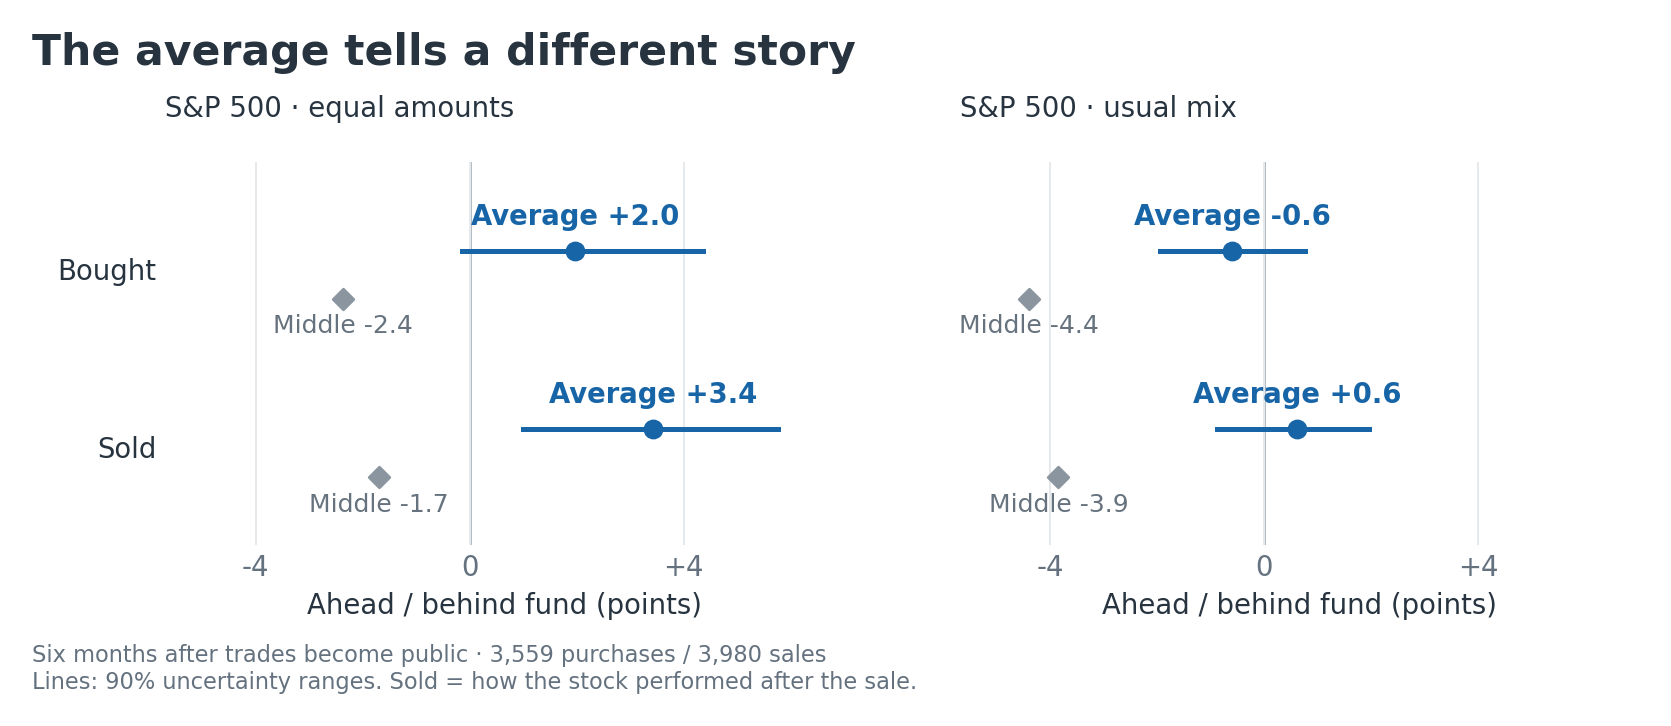
Stocks bought beat the equal-amount fund by 2.0 points. They trail the usual S&P 500 by 0.6. Both results have enough uncertainty to allow for no difference. Stocks sold subsequently do better than stocks bought.
A few big winners matter.
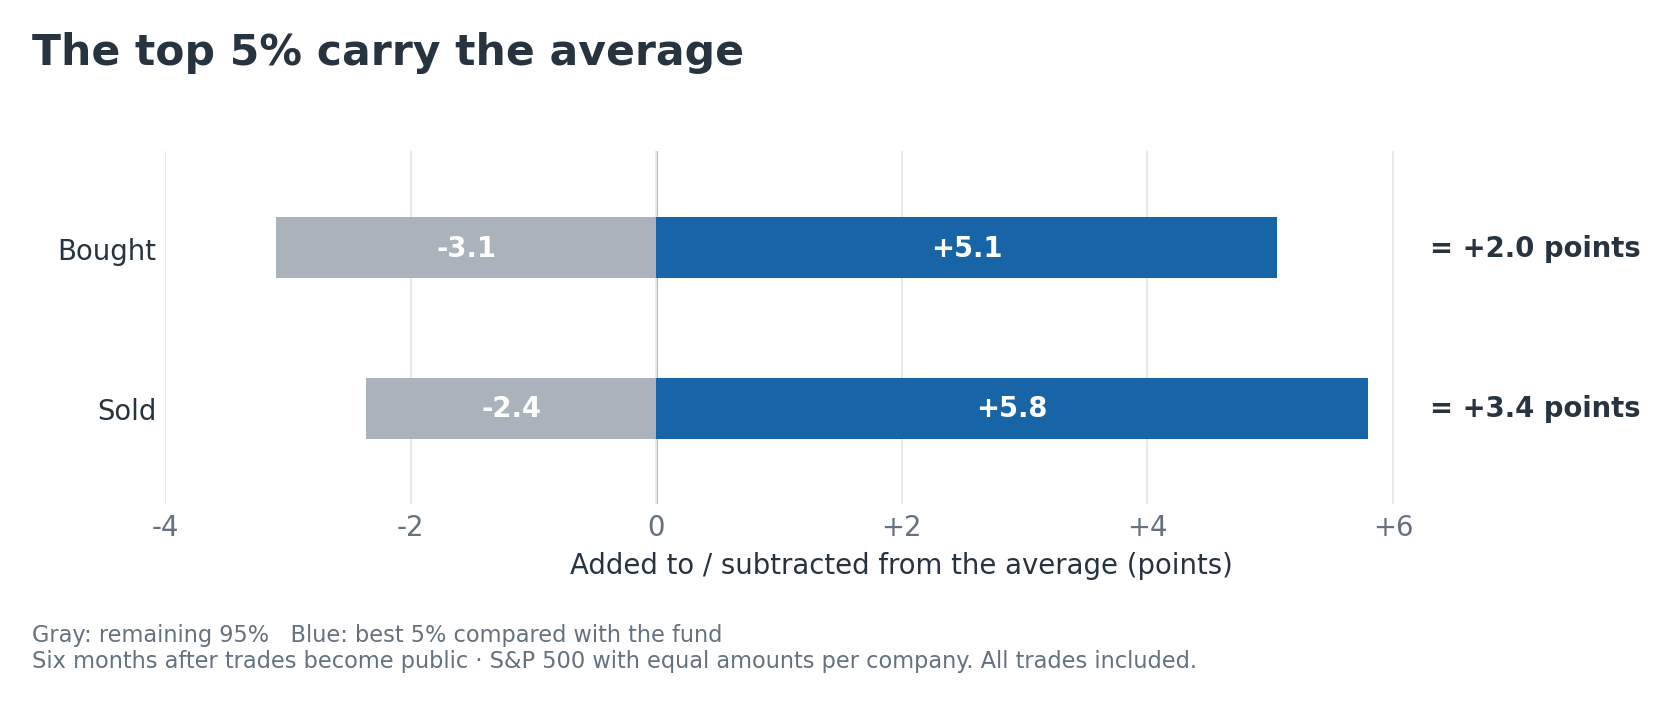
Only 46.3% of purchases beat the equal-amount fund. Most trades can lose to the market while the average still wins.
One, three and six months.
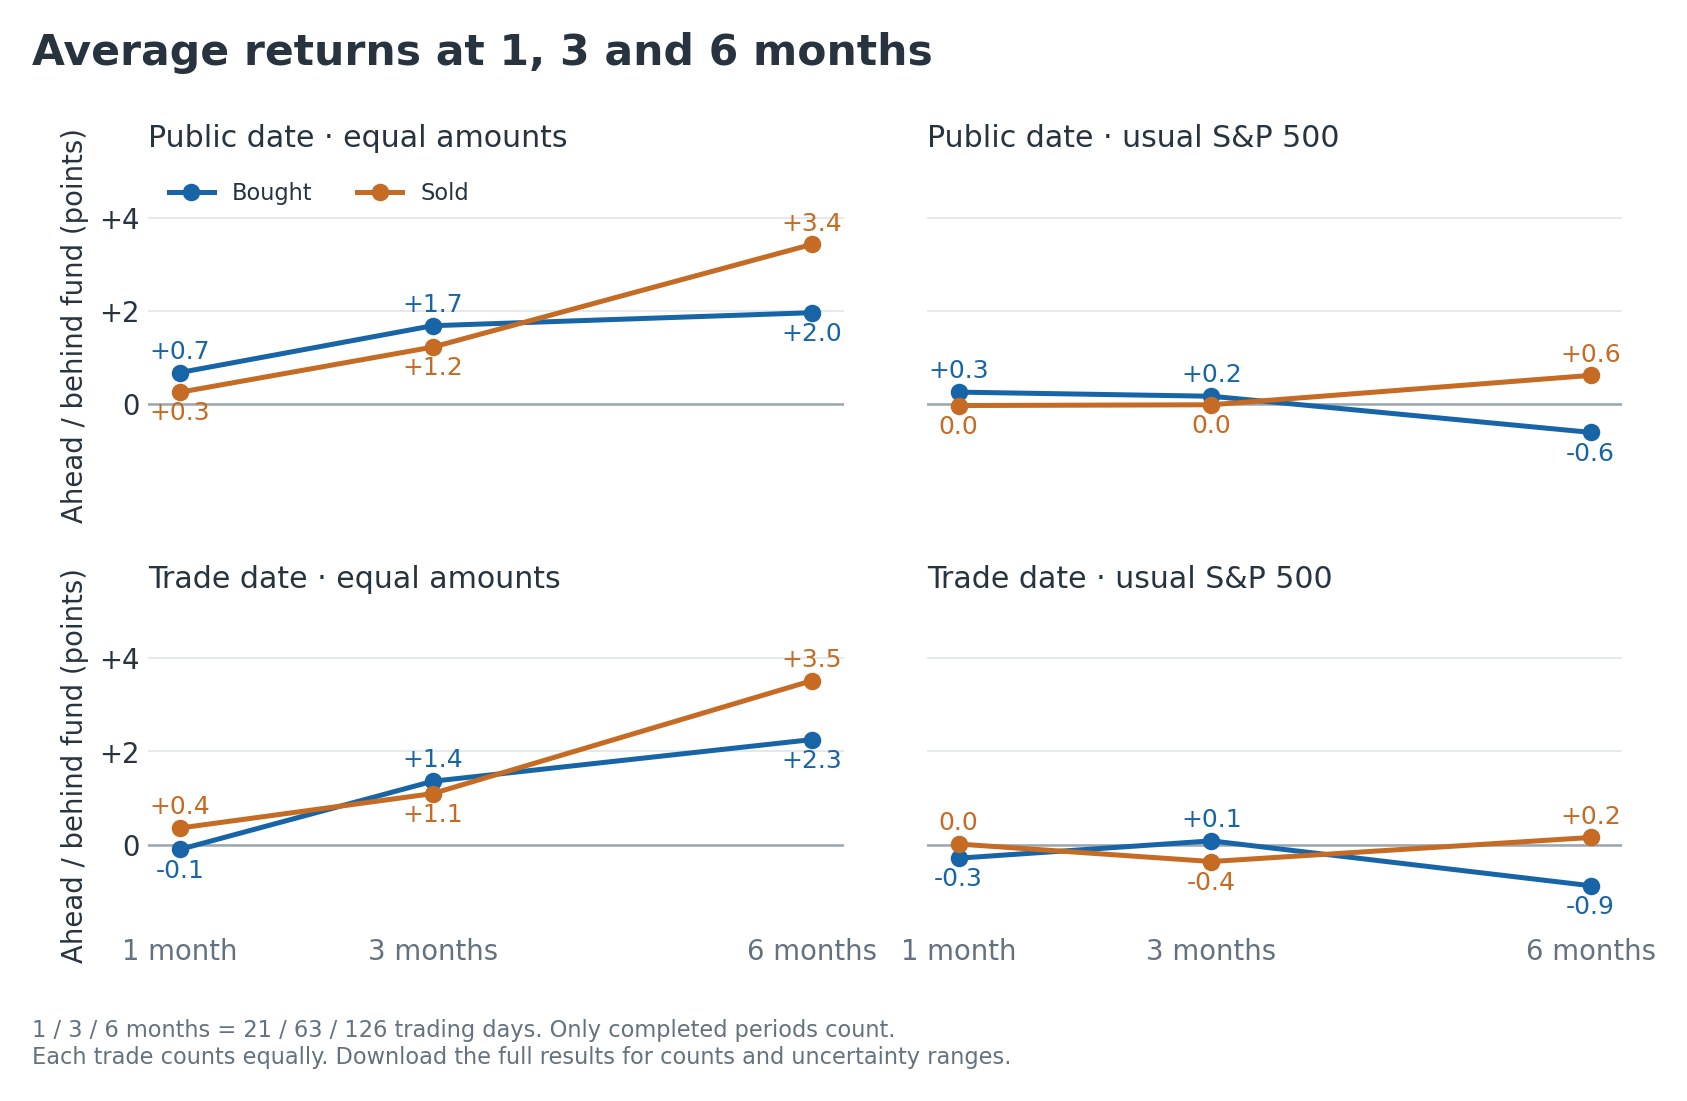
While buyers wait for trades to become public, the stocks fall 0.6 points behind the usual S&P 500 on average. Starting from the member’s trade date puts six-month returns 2.3 points ahead of the equal-amount fund, but 0.9 behind the usual S&P 500.
Break it down.
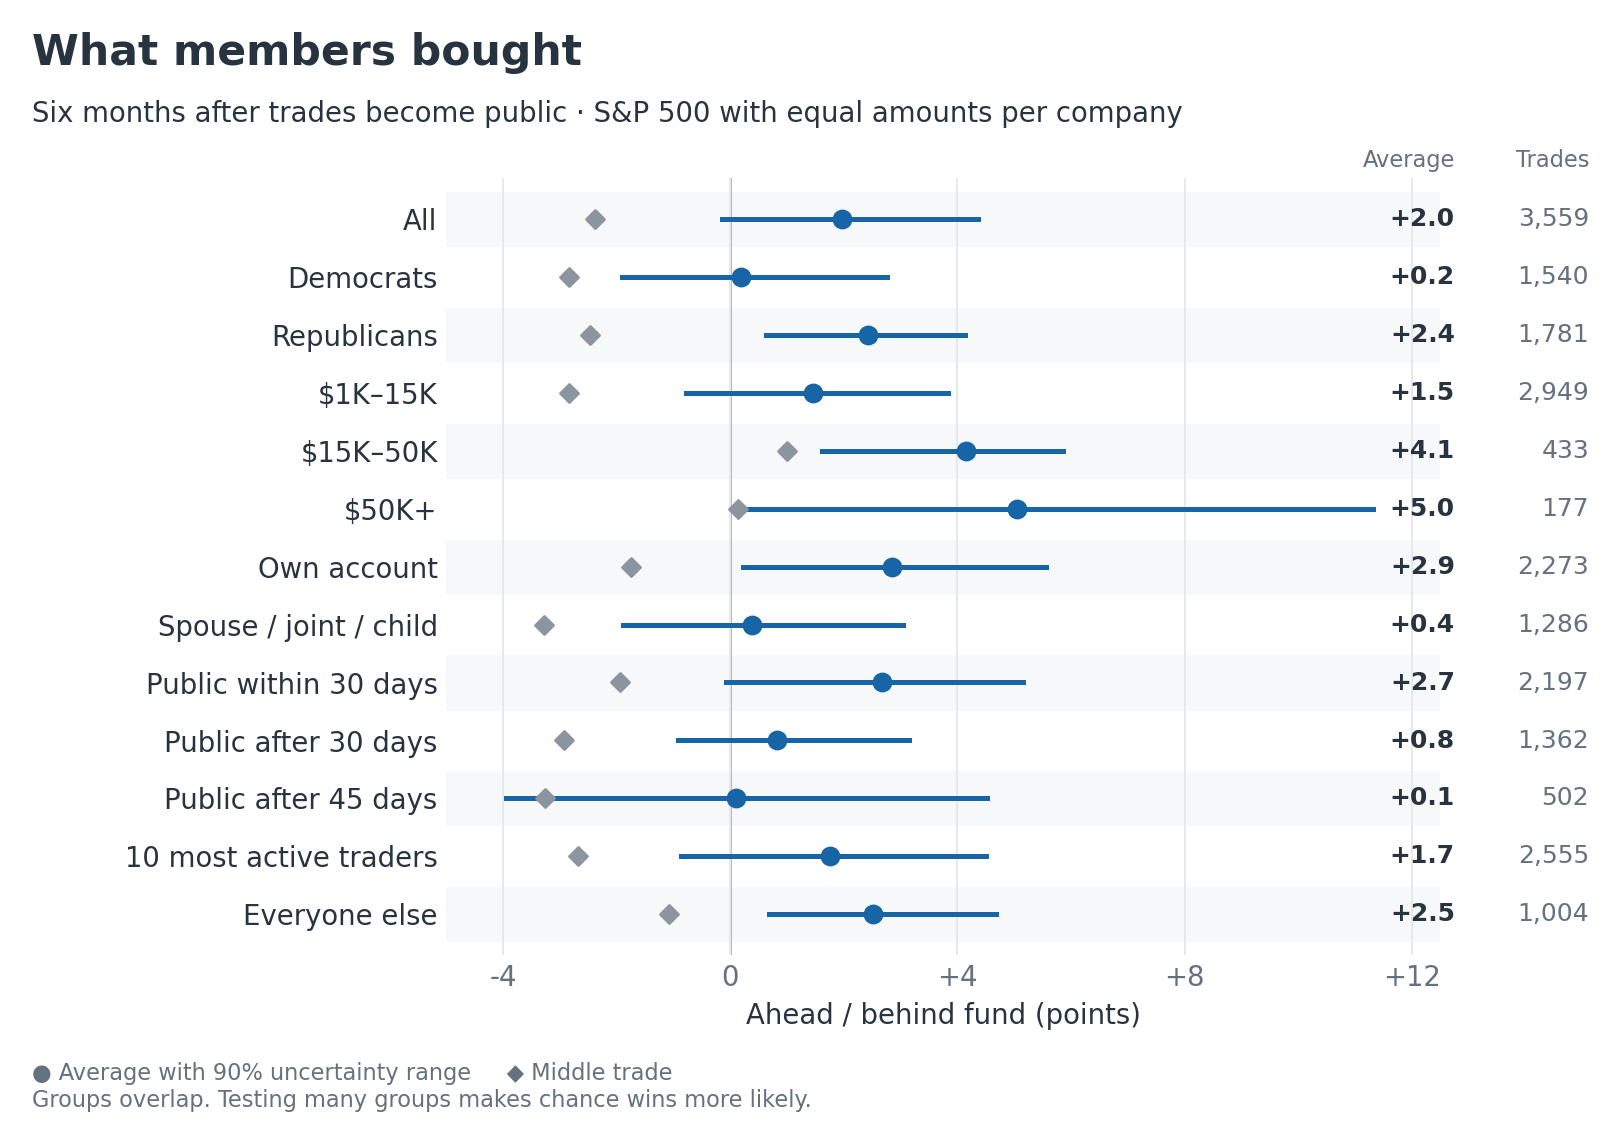
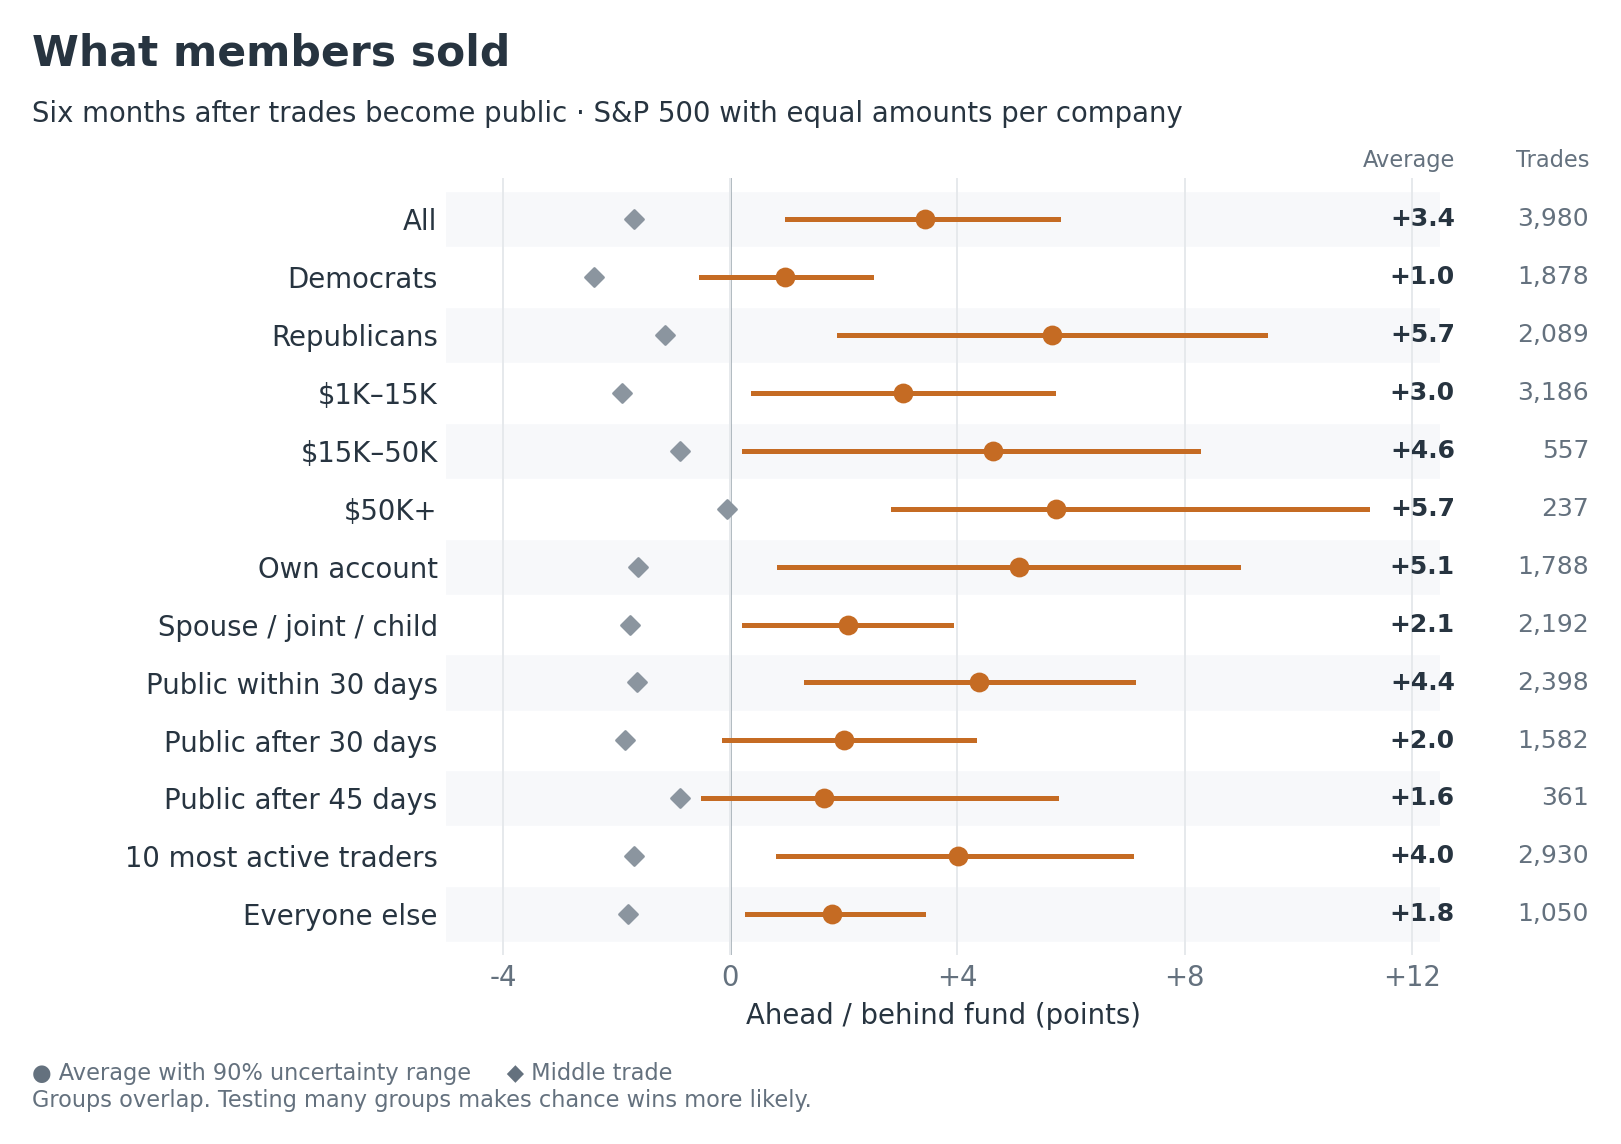
Several groups of purchases look better than the equal-amount fund. But these groups overlap, and testing many groups makes chance wins more likely. For sales, a positive number means the stock beat the fund after the member sold it.
Let bigger trades count more.
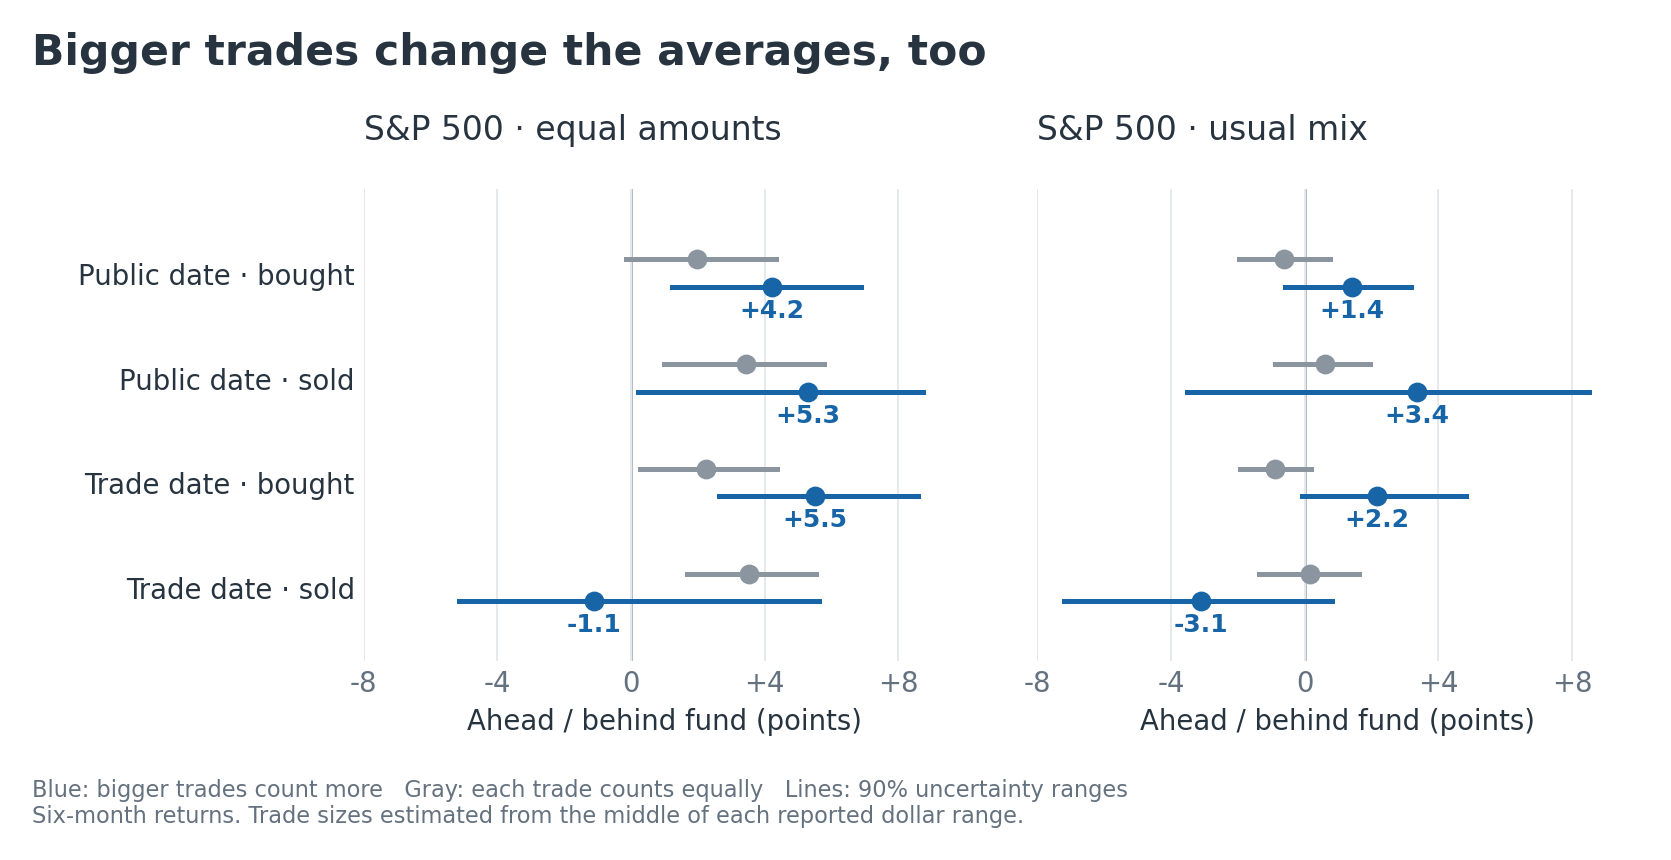
So far, each trade counts equally. If larger trades count more, purchases finish 4.2 points ahead of the equal-amount fund; 1.4 ahead of the usual S&P 500. Members report dollar ranges, so I estimated each trade’s size using the middle of its range.
How this was calculated
8,941 trades · 99 members · prices through Nov. 13, 2026. Same source data; same 1-, 3- and 6-month periods. Group counts match; middle-trade results differ by less than 0.15 points. Chart lines show 90% uncertainty ranges. These are individual stock returns, not a working investment strategy; trading costs, missing prices and differences in risk still matter.
All 312 results (CSV) · Check against the original (CSV) · Bought versus sold (CSV) · Methods and code (ZIP)